College admissions data, 2026–27
Adjusted SAT score ranges, 2026–27
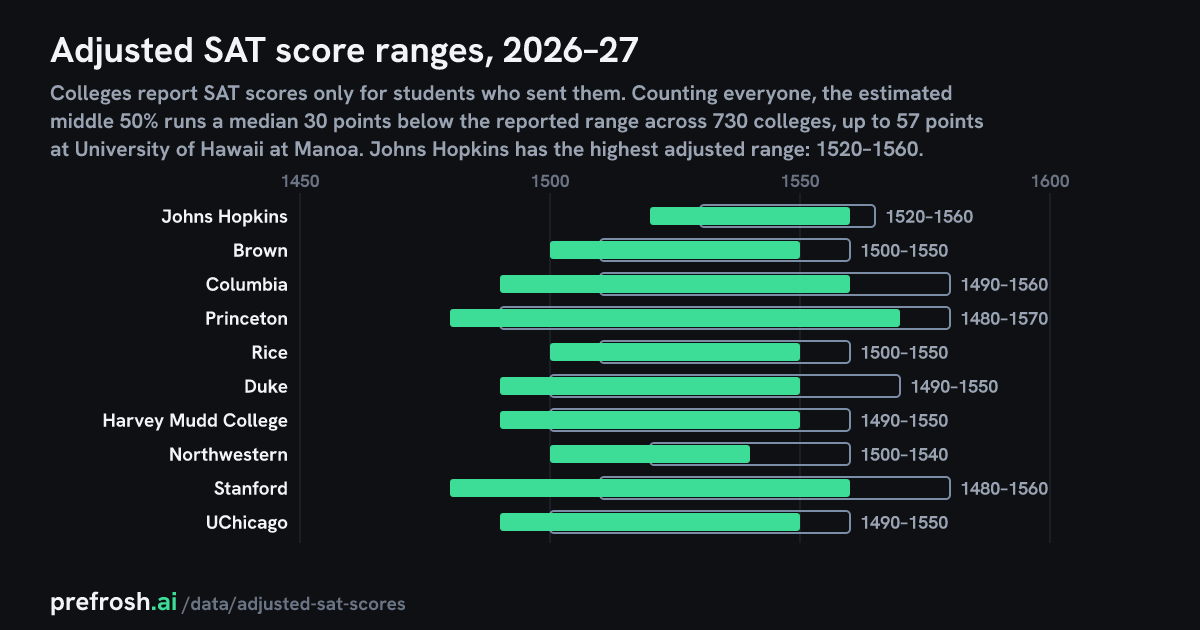
Colleges report SAT scores only for students who sent them. Counting everyone, the estimated middle 50% runs a median 30 points below the reported range across 730 colleges, up to 57 points at University of Hawaii at Manoa. Johns Hopkins has the highest adjusted range: 1520–1560.
Adjusted (estimate, all students)Reported (students who sent scores)30 highest adjusted ranges shown
All 730 colleges
| Estimated middle 50% of SAT scores for all students, including those who did not send scores. A prefrosh.ai estimate, rounded to 10. | The college's own Common Data Set middle 50%, covering only students who sent SAT scores. | Share of enrolled first-year students who submitted SAT scores. | Points between the middle of the reported range and the middle of the adjusted range. | The adjusted SAT range converted to ACT composite with the 2018 ACT and College Board concordance table. | The college's own Common Data Set middle 50% of ACT composite scores (students who sent ACT scores). | ||
|---|---|---|---|---|---|---|---|
| 1 | Johns Hopkins† MD | 1520–1560 | 1530–1565 | 56.8% | −8 | 35 | — |
| 2 | Brown† RI | 1500–1550 | 1510–1560 | 60.8% | −10 | 34–35 | — |
| 3 | Columbia NY | 1490–1560 | 1510–1580 | 44% | −20 | 34–35 | — |
| 4 | Princeton NJ | 1480–1570 | 1490–1580 | 59% | −10 | 34–36 | — |
| 5 | Rice TX | 1500–1550 | 1510–1560 | 59% | −10 | 34–35 | — |
| 6 | Duke NC | 1490–1550 | 1500–1570 | 48.2% | −15 | 34–35 | — |
| 7 | Harvey Mudd College CA | 1490–1550 | 1500–1560 | 55.1% | −10 | 34–35 | — |
| 8 | Northwestern† IL | 1500–1540 | 1520–1560 | 48% | −20 | 34–35 | — |
| 9 | Stanford† CA | 1480–1560 | 1510–1580 | 49% | −25 | 34–35 | — |
| 10 | UChicago IL | 1490–1550 | 1500–1560 | 56.6% | −10 | 34–35 | — |
| 11 | Penn† PA | 1480–1550 | 1510–1570 | 48% | −25 | 34–35 | — |
| 12 | Carnegie Mellon PA | 1470–1550 | 1500–1570 | 51% | −25 | 33–35 | — |
| 13 | Yale† CT | 1470–1550 | 1480–1560 | 66.9% | −10 | 33–35 | — |
| 14 | Vanderbilt TN | 1480–1530 | 1500–1570 | 24.2% | −30 | 34–35 | — |
| 15 | Cornell† NY | 1470–1530 | 1490–1550 | 42.8% | −20 | 33–35 | — |
| 16 | Williams College MA | 1470–1530 | 1490–1550 | 42.7% | −20 | 33–35 | — |
| 17 | Swarthmore College PA | 1460–1530 | 1480–1550 | 40.1% | −20 | 33–35 | — |
| 18 | Tufts MA | 1450–1540 | 1470–1560 | 37% | −20 | 33–35 | — |
| 19 | WashU MO | 1470–1520 | 1500–1550 | 31.6% | −30 | 33–35 | — |
| 20 | Emory GA | 1460–1520 | 1480–1540 | 46.5% | −20 | 33–35 | — |
| 21 | Pomona College CA | 1450–1530 | 1490–1560 | 35% | −35 | 33–35 | — |
| 22 | Amherst College MA | 1450–1520 | 1470–1540 | 39.6% | −20 | 33–35 | — |
| 23 | Colby College ME | 1440–1530 | 1460–1550 | 42% | −20 | 32–35 | — |
| 24 | Dartmouth† NH | 1430–1540 | 1440–1550 | 68.5% | −10 | 32–35 | — |
| 25 | NYU NY | 1450–1520 | 1480–1550 | 26.9% | −30 | 33–35 | — |
| 26 | Barnard College NY | 1450–1510 | 1480–1540 | 37.7% | −30 | 33–34 | — |
| 27 | Claremont McKenna College CA | 1450–1510 | 1480–1540 | 34.3% | −30 | 33–34 | — |
| 28 | Wellesley College MA | 1440–1520 | 1460–1540 | 43.9% | −20 | 32–35 | — |
| 29 | Bowdoin College ME | 1440–1510 | 1470–1540 | 34.8% | −30 | 32–34 | — |
| 30 | Carleton College MN | 1440–1510 | 1460–1530 | 39.4% | −20 | 32–34 | — |
| 31 | Haverford College PA | 1440–1510 | 1460–1530 | 39.8% | −20 | 32–34 | — |
| 32 | USC CA | 1440–1510 | 1470–1540 | 33.1% | −30 | 32–34 | — |
| 33 | Notre Dame IN | 1430–1510 | 1460–1540 | 34.3% | −30 | 32–34 | — |
| 34 | Case Western OH | 1420–1510 | 1440–1530 | 51.6% | −20 | 32–34 | — |
| 35 | Middlebury College VT | 1430–1500 | 1460–1530 | 33.4% | −30 | 32–34 | — |
| 36 | Boston College MA | 1430–1490 | 1460–1520 | 29.7% | −30 | 32–34 | — |
| 37 | Vassar College NY | 1430–1490 | 1460–1520 | 32.3% | −30 | 32–34 | — |
| 38 | Washington and Lee University VA | 1400–1510 | 1430–1540 | 28% | −30 | 31–34 | — |
| 39 | Colgate University NY | 1420–1480 | 1450–1510 | 22.6% | −30 | 32–34 | — |
| 40 | Grinnell College IA | 1380–1510 | 1410–1540 | 29% | −30 | 30–34 | — |
| 41 | Hamilton College NY | 1410–1480 | 1440–1510 | 34.7% | −30 | 31–34 | — |
| 42 | Northeastern MA | 1410–1480 | 1440–1510 | 22.2% | −30 | 31–34 | — |
| 43 | UVA VA | 1390–1500 | 1410–1520 | 45.6% | −20 | 31–34 | — |
| 44 | Michigan† MI | 1360–1520 | 1370–1530 | 55.1% | −10 | 30–35 | — |
| 45 | Smith College MA | 1390–1490 | 1420–1520 | 29.9% | −30 | 31–34 | — |
| 46 | Boston University MA | 1390–1480 | 1420–1510 | 36.4% | −30 | 31–34 | — |
| 47 | Illinois IL | 1370–1500 | 1390–1520 | 42.6% | −20 | 30–34 | — |
| 48 | Maryland† MD | 1380–1490 | 1410–1520 | 37.1% | −30 | 30–34 | — |
| 49 | Scripps College CA | 1400–1470 | 1430–1500 | 18.9% | −30 | 31–33 | — |
| 50 | Tulane LA | 1400–1470 | 1430–1500 | 10.9% | −30 | 31–33 | — |
| 51 | UNC NC | 1370–1500 | 1400–1530 | 21.7% | −30 | 30–34 | — |
| 52 | William & Mary VA | 1370–1500 | 1390–1520 | 47.7% | −20 | 30–34 | — |
| 53 | Davidson College NC | 1380–1470 | 1410–1500 | 25.4% | −30 | 30–33 | — |
| 54 | Oberlin College OH | 1340–1510 | 1360–1520 | 37% | −15 | 29–34 | — |
| 55 | Occidental College CA | 1370–1480 | 1400–1510 | 25% | −30 | 30–34 | — |
| 56 | Rochester NY | 1370–1480 | 1400–1510 | 15.9% | −30 | 30–34 | — |
| 57 | University of Richmond VA | 1390–1460 | 1420–1490 | 18.6% | −30 | 31–33 | — |
| 58 | Villanova PA | 1390–1460 | 1420–1490 | 19.2% | −30 | 31–33 | — |
| 59 | Wake Forest NC | 1390–1460 | 1420–1490 | 23.6% | −30 | 31–33 | — |
| 60 | Connecticut College CT | 1350–1490 | 1370–1510 | 52.1% | −20 | 29–34 | — |
| 61 | RISD RI | 1350–1490 | 1396–1530 | 18% | −43 | 29–34 | — |
| 62 | RPI NY | 1360–1480 | 1380–1500 | 52.6% | −20 | 30–34 | — |
| 63 | Kenyon College OH | 1370–1460 | 1400–1495 | 7.3% | −33 | 30–33 | — |
| 64 | Stevens NJ | 1350–1480 | 1380–1505 | 46% | −28 | 29–34 | — |
| 65 | Wisconsin WI | 1370–1460 | 1400–1490 | 11.8% | −30 | 30–33 | — |
| 66 | Wesleyan University CT | 1330–1490 | 1350–1510 | 43.5% | −20 | 29–34 | — |
| 67 | Bucknell University PA | 1330–1480 | 1340–1490 | 68.5% | −10 | 29–34 | — |
| 68 | Lehigh PA | 1350–1450 | 1380–1480 | 33% | −30 | 29–33 | — |
| 69 | Mount Holyoke College MA | 1340–1460 | 1365–1485 | 15.5% | −25 | 29–33 | — |
| 70 | Ohio State† OH | 1330–1470 | 1360–1500 | 15% | −30 | 29–33 | — |
| 71 | Trinity University TX | 1320–1480 | 1340–1500 | 42% | −20 | 28–34 | — |
| 72 | Lafayette College PA | 1330–1460 | 1360–1490 | 26.7% | −30 | 29–33 | — |
| 73 | Reed College OR | 1310–1480 | 1320–1490 | 61.1% | −10 | 28–34 | — |
| 74 | Yeshiva NY | 1310–1480 | 1340–1510 | 25% | −30 | 28–34 | — |
| 75 | Bates College ME | 1300–1480 | 1325–1510 | 13% | −28 | 28–34 | — |
| 76 | Brandeis MA | 1340–1440 | 1370–1470 | 28.8% | −30 | 29–32 | — |
| 77 | Mines CO | 1310–1470 | 1320–1480 | 45% | −10 | 28–33 | — |
| 78 | Soka University of America CA | 1300–1480 | 1333–1510 | 38% | −32 | 28–34 | — |
| 79 | UMKC MO | 1260–1520 | 1290–1550 | 3% | −30 | 27–35 | — |
| 80 | Hillsdale College MI | 1300–1470 | 1320–1490 | 28% | −20 | 28–33 | — |
| 81 | Macalester College MN | 1320–1450 | 1350–1480 | 34.6% | −30 | 28–33 | — |
| 82 | Rhodes College TN | 1330–1440 | 1360–1470 | 19.8% | −30 | 29–32 | — |
| 83 | Rutgers NJ | 1290–1480 | 1310–1500 | 50.9% | −20 | 27–34 | — |
| 84 | SMU TX | 1330–1440 | 1360–1470 | 9.4% | −30 | 29–32 | — |
| 85 | Binghamton NY | 1300–1460 | 1320–1480 | 43.1% | −20 | 28–33 | — |
| 86 | Franklin & Marshall College PA | 1300–1460 | 1310–1470 | 62.4% | −10 | 28–33 | — |
| 87 | Miami FL | 1300–1460 | 1320–1480 | 35% | −20 | 28–33 | — |
| 88 | Skidmore College NY | 1330–1430 | 1360–1460 | 24.7% | −30 | 29–32 | — |
| 89 | Stony Brook NY | 1320–1440 | 1350–1470 | 38% | −30 | 28–32 | — |
| 90 | Trinity College CT | 1320–1430 | 1350–1460 | 9% | −30 | 28–32 | — |
| 91 | UMass Amherst MA | 1300–1450 | 1330–1480 | 24.9% | −30 | 28–33 | — |
| 92 | Santa Clara CA | 1300–1440 | 1330–1470 | 28.8% | −30 | 28–32 | — |
| 93 | Union College NY | 1280–1460 | 1310–1480 | 38% | −25 | 27–33 | — |
| 94 | UT Austin† TX | 1240–1500 | 1250–1510 | 63% | −10 | 26–34 | — |
| 95 | University of Tulsa OK | 1210–1520 | 1223–1530 | 25% | −12 | 25–35 | — |
| 96 | Whitman College WA | 1280–1450 | 1310–1480 | 22% | −30 | 27–33 | — |
| 97 | Bryn Mawr College PA | 1250–1470 | 1280–1510 | 34% | −35 | 26–33 | — |
| 98 | Dickinson College PA | 1310–1410 | 1340–1440 | 13.4% | −30 | 28–31 | — |
| 99 | Fordham NY | 1280–1440 | 1320–1480 | 27% | −40 | 27–32 | — |
| 100 | RIT NY | 1280–1440 | 1300–1460 | 45% | −20 | 27–32 | — |
| 101 | Brigham Young University UT | 1260–1450 | 1270–1460 | 13% | −10 | 27–33 | — |
| 102 | Minnesota MN | 1280–1430 | 1310–1460 | 7.3% | −30 | 27–32 | — |
| 103 | American DC | 1290–1410 | 1320–1440 | 15.9% | −30 | 27–31 | — |
| 104 | GW DC | 1280–1420 | 1310–1450 | 36.5% | −30 | 27–32 | — |
| 105 | St. Olaf College MN | 1290–1410 | 1320–1440 | 12.7% | −30 | 27–31 | — |
| 106 | Clark University MA | 1270–1420 | 1300–1450 | 15.8% | −30 | 27–32 | — |
| 107 | Florida State† FL | 1290–1400 | 1300–1410 | 59.4% | −10 | 27–31 | — |
| 108 | NC State NC | 1280–1410 | 1310–1440 | 11.3% | −30 | 27–31 | — |
| 109 | Pitt PA | 1250–1440 | 1280–1460 | 40.3% | −25 | 26–32 | — |
| 110 | St. John's College (NM) NM | 1260–1430 | 1290–1460 | 26% | −30 | 27–32 | — |
| 111 | Wheaton College (IL) IL | 1240–1450 | 1260–1470 | 38% | −20 | 26–33 | — |
| 112 | Gettysburg College† PA | 1240–1430 | 1270–1460 | 23.3% | −30 | 26–32 | — |
| 113 | University of Vermont VT | 1270–1400 | 1300–1430 | 31.6% | −30 | 27–31 | — |
| 114 | Virginia Tech VA | 1250–1420 | 1280–1450 | 42.4% | −30 | 26–32 | — |
| 115 | Colorado College CO | 1210–1440 | 1230–1460 | 34% | −20 | 25–32 | — |
| 116 | Georgia† GA | 1240–1410 | 1250–1420 | 73.3% | −10 | 26–31 | — |
| 117 | St. John's College (MD) MD | 1240–1410 | 1270–1440 | 40% | −30 | 26–31 | — |
| 118 | Syracuse NY | 1270–1380 | 1300–1410 | 23.4% | −30 | 27–30 | — |
| 119 | Creighton NE | 1230–1410 | 1243–1428 | 14% | −16 | 26–31 | — |
| 120 | Patrick Henry College† VA | 1230–1410 | 1240–1420 | 64% | −10 | 26–31 | — |
| 121 | College of Wooster OH | 1220–1410 | 1245–1440 | 19.9% | −28 | 25–31 | — |
| 122 | Denison University OH | 1240–1390 | 1270–1420 | 26.6% | −30 | 26–31 | — |
| 123 | Furman University SC | 1250–1380 | 1280–1410 | 24.3% | −30 | 26–30 | — |
| 124 | Loyola Marymount University CA | 1230–1400 | 1260–1430 | 19.9% | −30 | 26–31 | — |
| 125 | Penn State PA | 1250–1380 | 1280–1410 | 28.6% | −30 | 26–30 | — |
| 126 | United States Air Force Academy† CO | 1210–1420 | 1230–1440 | 51% | −20 | 25–32 | — |
| 127 | Chapman CA | 1220–1400 | 1260–1440 | 25% | −40 | 25–31 | — |
| 128 | Coast Guard Academy CT | 1230–1390 | 1240–1400 | 67% | −10 | 26–31 | — |
| 129 | UConn CT | 1230–1390 | 1260–1420 | 35.1% | −30 | 26–31 | — |
| 130 | Clemson SC | 1220–1390 | 1240–1410 | 45% | −20 | 25–31 | — |
| 131 | Emerson MA | 1230–1380 | 1270–1420 | 22% | −40 | 26–30 | — |
| 132 | NJIT NJ | 1200–1410 | 1220–1430 | 44.3% | −20 | 25–31 | — |
| 133 | United States Military Academy at West Point† NY | 1200–1410 | 1210–1420 | 68.4% | −10 | 25–31 | — |
| 134 | University of Alabama at Birmingham AL | 1220–1390 | 1250–1420 | 4.6% | −30 | 25–31 | — |
| 135 | University of St. Thomas (MN) MN | 1220–1390 | 1260–1423 | 3% | −37 | 25–31 | — |
| 136 | Westmont College CA | 1200–1410 | 1240–1450 | 20% | −40 | 25–31 | — |
| 137 | Bennington College VT | 1240–1360 | 1291–1403 | 13% | −47 | 26–30 | — |
| 138 | Drexel PA | 1200–1400 | 1240–1440 | 35% | −40 | 25–31 | — |
| 139 | Lawrence University WI | 1210–1390 | 1240–1420 | 21.1% | −30 | 25–31 | — |
| 140 | Muhlenberg College PA | 1220–1380 | 1250–1410 | 32% | −30 | 25–30 | — |
| 141 | United States Naval Academy† MD | 1200–1400 | 1210–1410 | 74% | −10 | 25–31 | — |
| 142 | University of Tennessee–Knoxville† TN | 1250–1350 | 1280–1380 | 24.6% | −30 | 26–29 | — |
| 143 | Auburn† AL | 1230–1360 | 1260–1390 | 18.5% | −30 | 26–30 | — |
| 144 | College of the Holy Cross MA | 1210–1380 | 1240–1410 | 35% | −30 | 25–30 | — |
| 145 | Fisk University† TN | 1110–1480 | 1140–1510 | 35% | −30 | 22–34 | — |
| 146 | Pepperdine CA | 1210–1380 | 1240–1410 | 17.2% | −30 | 25–30 | — |
| 147 | Sarah Lawrence College NY | 1200–1390 | 1240–1430 | 15% | −40 | 25–31 | — |
| 148 | St. Lawrence University NY | 1240–1350 | 1270–1380 | 13.6% | −30 | 26–29 | — |
| 149 | Thomas Aquinas College† CA | 1200–1390 | 1220–1400 | 45% | −15 | 25–31 | — |
| 150 | University of Maryland Baltimore County MD | 1220–1370 | 1250–1400 | 33.4% | −30 | 25–30 | — |
| 151 | University of the Pacific CA | 1150–1440 | 1183–1480 | 26% | −37 | 23–32 | — |
| 152 | Fairfield University CT | 1240–1340 | 1270–1370 | 13.7% | −30 | 26–29 | — |
| 153 | Illinois Institute of Technology IL | 1160–1420 | 1180–1440 | 42% | −20 | 24–32 | — |
| 154 | Lewis & Clark College OR | 1220–1360 | 1260–1400 | 15% | −40 | 25–30 | — |
| 155 | Touro University NY | 1170–1410 | 1218–1453 | 10% | −46 | 24–31 | — |
| 156 | UAH AL | 1190–1390 | 1210–1410 | 6% | −20 | 24–31 | — |
| 157 | Centre College KY | 1140–1430 | 1160–1450 | 11% | −20 | 23–32 | — |
| 158 | Hofstra University NY | 1200–1370 | 1230–1400 | 35% | −30 | 25–30 | — |
| 159 | Beloit College WI | 1160–1390 | 1200–1430 | 11% | −40 | 24–31 | — |
| 160 | Ithaca NY | 1210–1340 | 1240–1370 | 22.2% | −30 | 25–29 | — |
| 161 | Miami University–Oxford OH | 1190–1360 | 1220–1390 | 15% | −30 | 24–30 | — |
| 162 | New York Institute of Technology NY | 1160–1390 | 1190–1420 | 46% | −30 | 24–31 | — |
| 163 | Seattle University WA | 1160–1390 | 1200–1430 | 24% | −40 | 24–31 | — |
| 164 | SLU MO | 1180–1370 | 1200–1410 | 9% | −30 | 24–30 | — |
| 165 | University of Central Florida† FL | 1210–1340 | 1220–1350 | 71.4% | −10 | 25–29 | — |
| 166 | Bentley† MA | 1200–1340 | 1230–1370 | 29.1% | −30 | 25–29 | — |
| 167 | Indiana IN | 1160–1380 | 1170–1400 | 38% | −15 | 24–30 | — |
| 168 | Missouri University of Science and Technology† MO | 1190–1350 | 1220–1380 | 11.8% | −30 | 24–29 | — |
| 169 | Seton Hall University NJ | 1190–1350 | 1220–1390 | 24% | −35 | 24–29 | — |
| 170 | University of Utah UT | 1170–1370 | 1190–1380 | 12% | −15 | 24–30 | — |
| 171 | Buffalo† NY | 1180–1350 | 1210–1380 | 26% | −30 | 24–29 | — |
| 172 | Ohio Northern University OH | 1150–1380 | 1175–1400 | 12% | −23 | 23–30 | — |
| 173 | Simmons University MA | 1180–1350 | 1220–1390 | 17% | −40 | 24–29 | — |
| 174 | University of North Carolina–Wilmington NC | 1210–1320 | 1240–1350 | 6.9% | −30 | 25–28 | — |
| 175 | Baylor TX | 1170–1350 | 1190–1370 | 47.3% | −20 | 24–29 | — |
| 176 | Champlain VT | 1180–1340 | 1220–1380 | 23% | −40 | 24–29 | — |
| 177 | DePauw University IN | 1150–1370 | 1170–1390 | 52.9% | −20 | 23–30 | — |
| 178 | Loyola Maryland MD | 1180–1340 | 1210–1370 | 13.8% | −30 | 24–29 | — |
| 179 | MSOE WI | 1180–1340 | 1205–1375 | 10.6% | −30 | 24–29 | — |
| 180 | University of San Francisco CA | 1170–1350 | 1200–1380 | 12.4% | −30 | 24–29 | — |
| 181 | Ursinus College PA | 1170–1350 | 1200–1385 | 36% | −33 | 24–29 | — |
| 182 | Wheaton College (MA) MA | 1180–1340 | 1215–1370 | 16% | −33 | 24–29 | — |
| 183 | Clarkson University† NY | 1170–1340 | 1190–1360 | 47.8% | −20 | 24–29 | — |
| 184 | Gonzaga WA | 1160–1350 | 1190–1380 | 28% | −30 | 24–29 | — |
| 185 | Hobart and William Smith Colleges NY | 1160–1350 | 1185–1380 | 22.7% | −28 | 24–29 | — |
| 186 | Lake Forest College† IL | 1170–1340 | 1200–1370 | 11% | −30 | 24–29 | — |
| 187 | SUNY Purchase NY | 1160–1350 | 1185–1380 | 6% | −28 | 24–29 | — |
| 188 | Union University TN | 1140–1370 | 1160–1390 | 11% | −20 | 23–30 | — |
| 189 | University of Arizona AZ | 1120–1390 | 1150–1420 | 19% | −30 | 22–31 | — |
| 190 | University of Colorado Boulder CO | 1150–1360 | 1180–1390 | 24.6% | −30 | 23–30 | — |
| 191 | University of Puget Sound WA | 1170–1340 | 1200–1370 | 29.7% | −30 | 24–29 | — |
| 192 | University of the South TN | 1180–1330 | 1210–1360 | 24.4% | −30 | 24–29 | — |
| 193 | Embry-Riddle FL | 1150–1350 | 1160–1360 | 58% | −10 | 23–29 | — |
| 194 | Knox College IL | 1120–1380 | 1150–1410 | 29.5% | −30 | 22–30 | — |
| 195 | Marquette WI | 1170–1330 | 1200–1360 | 17% | −30 | 24–29 | — |
| 196 | University of Dayton OH | 1180–1320 | 1210–1350 | 9.9% | −30 | 24–28 | — |
| 197 | University of Massachusetts–Lowell MA | 1170–1330 | 1200–1360 | 27.3% | −30 | 24–29 | — |
| 198 | University of South Carolina SC | 1170–1330 | 1200–1360 | 31.8% | −30 | 24–29 | — |
| 199 | Wofford College SC | 1170–1330 | 1198–1343 | 30% | −21 | 24–29 | — |
| 200 | Butler University IN | 1150–1340 | 1160–1350 | 50% | −10 | 23–29 | — |
| 201 | Delaware† DE | 1160–1330 | 1190–1370 | 25% | −35 | 24–29 | — |
| 202 | Grove City PA | 1120–1370 | 1141–1388 | 52% | −20 | 22–30 | — |
| 203 | Kalamazoo College MI | 1140–1350 | 1170–1380 | 38% | −30 | 23–29 | — |
| 204 | Loyola University Chicago IL | 1150–1340 | 1170–1360 | 26% | −20 | 23–29 | — |
| 205 | Rollins College FL | 1180–1310 | 1210–1340 | 24.8% | −30 | 24–28 | — |
| 206 | SUNY–Geneseo NY | 1190–1300 | 1220–1330 | 10.7% | −30 | 24–28 | — |
| 207 | UW–La Crosse WI | 1200–1290 | 1230–1318 | 1% | −29 | 25–27 | — |
| 208 | Covenant College† GA | 1130–1350 | 1160–1380 | 38% | −30 | 23–29 | — |
| 209 | George Mason University VA | 1150–1330 | 1180–1360 | 18.4% | −30 | 23–29 | — |
| 210 | Lipscomb TN | 1130–1350 | 1160–1380 | 3.1% | −30 | 23–29 | — |
| 211 | Transylvania University KY | 1110–1370 | 1120–1380 | 9% | −10 | 22–30 | — |
| 212 | Cedarville OH | 1120–1350 | 1130–1360 | 35% | −10 | 22–29 | — |
| 213 | Elon NC | 1160–1310 | 1190–1340 | 22.6% | −30 | 24–28 | — |
| 214 | Houghton University NY | 1130–1340 | 1170–1375 | 31% | −38 | 23–29 | — |
| 215 | UMN Duluth† MN | 1150–1320 | 1180–1350 | 2% | −30 | 23–28 | — |
| 216 | University of North Carolina–Asheville NC | 1140–1330 | 1170–1360 | 16% | −30 | 23–29 | — |
| 217 | Augustana SD | 1120–1340 | 1150–1370 | 6% | −30 | 22–29 | — |
| 218 | Bryant† RI | 1160–1300 | 1190–1330 | 19% | −30 | 24–28 | — |
| 219 | Hamline MN | 1100–1360 | 1133–1391 | 4% | −32 | 22–30 | — |
| 220 | Michigan Technological University MI | 1120–1340 | 1130–1350 | 66.2% | −10 | 22–29 | — |
| 221 | New Saint Andrews College† ID | 1130–1330 | 1155–1358 | 40% | −27 | 23–29 | — |
| 222 | Truman State University† MO | 1130–1330 | 1170–1370 | 10% | −40 | 23–29 | — |
| 223 | University of Denver CO | 1130–1330 | 1160–1360 | 25.1% | −30 | 23–29 | — |
| 224 | University of Mary Washington VA | 1130–1330 | 1170–1370 | 26% | −40 | 23–29 | — |
| 225 | Agnes Scott College GA | 1140–1310 | 1160–1330 | 33% | −20 | 23–28 | — |
| 226 | Allegheny College PA | 1120–1330 | 1155–1360 | 30.5% | −33 | 22–29 | — |
| 227 | Belmont University TN | 1130–1320 | 1160–1350 | 23% | −30 | 23–28 | — |
| 228 | Biola CA | 1120–1330 | 1160–1370 | 26% | −40 | 22–29 | — |
| 229 | Embry-Riddle Prescott AZ | 1110–1340 | 1140–1370 | 34% | −30 | 22–29 | — |
| 230 | Hendrix College AR | 1110–1340 | 1123–1348 | 15% | −11 | 22–29 | — |
| 231 | Iowa IA | 1120–1330 | 1130–1330 | 21% | −5 | 22–29 | — |
| 232 | John Carroll OH | 1150–1300 | 1180–1330 | 18% | −30 | 23–28 | — |
| 233 | Kettering MI | 1140–1310 | 1160–1330 | 53% | −20 | 23–28 | — |
| 234 | Manhattan NY | 1140–1310 | 1180–1358 | 18% | −44 | 23–28 | — |
| 235 | Marist NY | 1150–1300 | 1190–1340 | 18% | −40 | 23–28 | — |
| 236 | Point Loma Nazarene CA | 1130–1320 | 1175–1365 | 10% | −45 | 23–28 | — |
| 237 | Washington College MD | 1100–1350 | 1140–1390 | 29% | −40 | 22–29 | — |
| 238 | Duquesne University PA | 1140–1300 | 1180–1340 | 28% | −40 | 23–28 | — |
| 239 | Endicott MA | 1150–1290 | 1193–1340 | 18% | −47 | 23–27 | — |
| 240 | Florida Southern FL | 1130–1310 | 1150–1330 | 40% | −20 | 23–28 | — |
| 241 | Mercer University† GA | 1140–1300 | 1170–1330 | 39.7% | −30 | 23–28 | — |
| 242 | Pace NY | 1140–1300 | 1180–1340 | 18% | −40 | 23–28 | — |
| 243 | Saint Joseph's University PA | 1130–1310 | 1170–1350 | 28% | −40 | 23–28 | — |
| 244 | SD Mines SD | 1120–1320 | 1140–1340 | 26% | −20 | 22–28 | — |
| 245 | ULM† LA | 1120–1320 | 1160–1360 | 15% | −40 | 22–28 | — |
| 246 | Dallas† TX | 1090–1340 | 1120–1370 | 26% | −30 | 21–29 | — |
| 247 | Fredonia NY | 1110–1320 | 1160–1370 | 12% | −50 | 22–28 | — |
| 248 | James Madison University VA | 1130–1300 | 1170–1340 | 23% | −40 | 23–28 | — |
| 249 | TCNJ NJ | 1120–1310 | 1140–1330 | 49.9% | −20 | 22–28 | — |
| 250 | Thomas Jefferson University PA | 1130–1300 | 1160–1330 | 27% | −30 | 23–28 | — |
| 251 | University of Portland OR | 1110–1320 | 1160–1370 | 13% | −50 | 22–28 | — |
| 252 | Caldwell NJ | 1090–1330 | 1130–1370 | 23% | −40 | 21–29 | — |
| 253 | Eckerd College FL | 1130–1290 | 1160–1320 | 26.4% | −30 | 23–27 | — |
| 254 | Florida Institute of Technology† FL | 1110–1310 | 1120–1320 | 72% | −10 | 22–28 | — |
| 255 | LIU NY | 1090–1330 | 1110–1350 | 51% | −20 | 21–29 | — |
| 256 | Louisiana State University and Agricultural & Mechanical College LA | 1140–1280 | 1180–1320 | 7.2% | −40 | 23–27 | — |
| 257 | Messiah PA | 1090–1330 | 1110–1350 | 56% | −20 | 21–29 | — |
| 258 | New Paltz NY | 1120–1300 | 1170–1340 | 17% | −45 | 22–28 | — |
| 259 | Ohio Wesleyan University OH | 1090–1330 | 1123–1358 | 15% | −31 | 21–29 | — |
| 260 | St. Mary's College of Maryland MD | 1110–1310 | 1143–1340 | 22% | −32 | 22–28 | — |
| 261 | University of Cincinnati OH | 1120–1300 | 1160–1340 | 9% | −40 | 22–28 | — |
| 262 | Emmanuel College MA | 1120–1290 | 1170–1340 | 15% | −50 | 22–27 | — |
| 263 | Gordon College MA | 1090–1320 | 1130–1355 | 24% | −38 | 21–28 | — |
| 264 | Immaculata PA | 1120–1290 | 1156–1323 | 26% | −35 | 22–27 | — |
| 265 | Juniata College PA | 1120–1290 | 1150–1320 | 27.1% | −30 | 22–27 | — |
| 266 | Le Moyne NY | 1120–1290 | 1160–1330 | 24% | −40 | 22–27 | — |
| 267 | Luther College IA | 1040–1370 | 1078–1406 | 8% | −37 | 20–30 | — |
| 268 | Salve Regina† RI | 1120–1290 | 1160–1330 | 20% | −40 | 22–27 | — |
| 269 | St. John's University NY | 1110–1300 | 1150–1340 | 30% | −40 | 22–28 | — |
| 270 | University of Houston TX | 1120–1290 | 1140–1310 | 55.3% | −20 | 22–27 | — |
| 271 | University of North Carolina at Charlotte NC | 1110–1300 | 1150–1340 | 16.1% | −40 | 22–28 | — |
| 272 | University of North Carolina–Greensboro NC | 1100–1310 | 1150–1355 | 5% | −48 | 22–28 | — |
| 273 | University of Oklahoma OK | 1130–1280 | 1160–1310 | 21.7% | −30 | 23–27 | — |
| 274 | University of Scranton PA | 1120–1290 | 1160–1318 | 24.9% | −34 | 22–27 | — |
| 275 | Franciscan Steubenville OH | 1080–1320 | 1110–1350 | 30% | −30 | 21–28 | — |
| 276 | Illinois Wesleyan IL | 1090–1310 | 1120–1340 | 26.3% | −30 | 21–28 | — |
| 277 | Iowa State University of Science and Technology† IA | 1080–1320 | 1120–1360 | 19% | −40 | 21–28 | — |
| 278 | Mizzou MO | 1100–1300 | 1150–1330 | 10% | −40 | 22–28 | — |
| 279 | Saint Mary's College IN | 1100–1300 | 1130–1325 | 30% | −28 | 22–28 | — |
| 280 | Wabash College IN | 1100–1300 | 1130–1335 | 40.5% | −33 | 22–28 | — |
| 281 | Wagner NY | 1150–1250 | 1190–1290 | 17% | −40 | 23–26 | — |
| 282 | Calvin MI | 1070–1320 | 1083–1330 | 61% | −12 | 21–28 | — |
| 283 | Drake University IA | 1080–1310 | 1110–1350 | 17% | −35 | 21–28 | — |
| 284 | Quinnipiac University CT | 1110–1280 | 1150–1320 | 28% | −40 | 22–27 | — |
| 285 | Siena NY | 1070–1320 | 1110–1360 | 31% | −40 | 21–28 | — |
| 286 | Southwestern University† TX | 1110–1280 | 1130–1300 | 46.5% | −20 | 22–27 | — |
| 287 | Berea College KY | 1110–1270 | 1136–1298 | 8% | −27 | 22–27 | — |
| 288 | Drew University NJ | 1080–1300 | 1103–1338 | 32% | −31 | 21–28 | — |
| 289 | Taylor IN | 1060–1320 | 1070–1330 | 60% | −10 | 21–28 | — |
| 290 | TCU TX | 1080–1300 | 1110–1330 | 27.3% | −30 | 21–28 | — |
| 291 | University of Alabama† AL | 1060–1320 | 1100–1360 | 18.6% | −40 | 21–28 | — |
| 292 | Whittier College CA | 1090–1290 | 1140–1340 | 9% | −50 | 21–27 | — |
| 293 | College of Charleston SC | 1110–1260 | 1150–1300 | 17.7% | −40 | 22–27 | — |
| 294 | High Point NC | 1080–1290 | 1110–1320 | 25% | −30 | 21–27 | — |
| 295 | Lebanon Valley PA | 1100–1270 | 1140–1302 | 25% | −36 | 22–27 | — |
| 296 | Meredith College NC | 1060–1310 | 1098–1348 | 16% | −38 | 21–28 | — |
| 297 | Michigan State† MI | 1080–1290 | 1100–1310 | 51.5% | −20 | 21–27 | — |
| 298 | Monmouth University NJ | 1100–1270 | 1140–1310 | 23% | −40 | 22–27 | — |
| 299 | Oral Roberts OK | 1090–1280 | 1120–1310 | 18% | −30 | 21–27 | — |
| 300 | Providence RI | 1080–1290 | 1100–1310 | 49.5% | −20 | 21–27 | — |
| 301 | Xavier University OH | 1090–1280 | 1103–1310 | 15% | −22 | 21–27 | — |
| 302 | Adelphi University NY | 1070–1290 | 1120–1340 | 5% | −50 | 21–27 | — |
| 303 | DeSales PA | 1090–1270 | 1120–1300 | 24.2% | −30 | 21–27 | — |
| 304 | Dordt IA | 1050–1310 | 1070–1330 | 21% | −20 | 20–28 | — |
| 305 | Drury MO | 1100–1260 | 1130–1290 | 7% | −30 | 22–27 | — |
| 306 | Goucher College MD | 1070–1290 | 1100–1320 | 23% | −30 | 21–27 | — |
| 307 | Hope College MI | 1060–1300 | 1100–1340 | 48% | −40 | 21–28 | — |
| 308 | Redlands CA | 1060–1300 | 1107–1350 | 16% | −49 | 21–28 | — |
| 309 | Webster MO | 1080–1280 | 1110–1310 | 9% | −30 | 21–27 | — |
| 310 | Elizabethtown PA | 1070–1280 | 1105–1310 | 31% | −33 | 21–27 | — |
| 311 | Hartford† CT | 1080–1270 | 1120–1310 | 23% | −40 | 21–27 | — |
| 312 | John Brown AR | 1040–1310 | 1070–1340 | 10% | −30 | 20–28 | — |
| 313 | Maritime NY | 1090–1260 | 1123–1288 | 31% | −31 | 21–27 | — |
| 314 | Oneonta NY | 1080–1270 | 1120–1310 | 25% | −40 | 21–27 | — |
| 315 | University of Kansas KS | 1060–1290 | 1070–1300 | 9% | −10 | 21–27 | — |
| 316 | University of New Hampshire NH | 1080–1270 | 1120–1310 | 19.4% | −40 | 21–27 | — |
| 317 | App State NC | 1090–1250 | 1120–1280 | 12% | −30 | 21–26 | — |
| 318 | Austin College TX | 1080–1260 | 1120–1300 | 20.9% | −40 | 21–27 | — |
| 319 | Berry GA | 1080–1260 | 1110–1290 | 21% | −30 | 21–27 | — |
| 320 | California Lutheran University CA | 1060–1280 | 1100–1320 | 11% | −40 | 21–27 | — |
| 321 | Earlham College IN | 1080–1260 | 1110–1290 | 25% | −30 | 21–27 | — |
| 322 | MSU Moorhead MN | 1060–1280 | 1080–1290 | 1% | −15 | 21–27 | — |
| 323 | Ramapo NJ | 1100–1240 | 1145–1280 | 21.2% | −43 | 22–26 | — |
| 324 | Rowan University NJ | 1070–1270 | 1100–1300 | 25.8% | −30 | 21–27 | — |
| 325 | Spelman College GA | 1070–1270 | 1100–1300 | 30.1% | −30 | 21–27 | — |
| 326 | St. John Fisher NY | 1080–1260 | 1120–1300 | 20.7% | −40 | 21–27 | — |
| 327 | University at Albany–SUNY NY | 1070–1270 | 1120–1320 | 15% | −50 | 21–27 | — |
| 328 | University of Rhode Island RI | 1060–1280 | 1090–1310 | 22.6% | −30 | 21–27 | — |
| 329 | Whitworth University WA | 1050–1290 | 1090–1330 | 30% | −40 | 20–27 | — |
| 330 | Alfred NY | 1060–1270 | 1095–1310 | 29% | −38 | 21–27 | — |
| 331 | Baldwin Wallace OH | 1050–1280 | 1060–1290 | 28% | −10 | 20–27 | — |
| 332 | Colorado State University CO | 1060–1270 | 1080–1290 | 43% | −20 | 21–27 | — |
| 333 | Cornell College IA | 1080–1250 | 1120–1285 | 10% | −38 | 21–26 | — |
| 334 | DePaul University IL | 1060–1270 | 1090–1300 | 41.7% | −30 | 21–27 | — |
| 335 | George Fox OR | 1030–1300 | 1070–1340 | 11% | −40 | 20–28 | — |
| 336 | Louisiana Tech† LA | 1060–1270 | 1100–1310 | 4% | −40 | 21–27 | — |
| 337 | Roanoke College VA | 1060–1270 | 1090–1300 | 37% | −30 | 21–27 | — |
| 338 | Springfield MA | 1040–1290 | 1080–1330 | 5% | −40 | 20–27 | — |
| 339 | Susquehanna University PA | 1070–1260 | 1100–1290 | 38% | −30 | 21–27 | — |
| 340 | Sweet Briar College VA | 1060–1270 | 1100–1310 | 22% | −40 | 21–27 | — |
| 341 | Evansville IN | 1030–1290 | 1045–1300 | 51% | −13 | 20–27 | — |
| 342 | Jacksonville U FL | 1070–1250 | 1100–1280 | 26% | −30 | 21–26 | — |
| 343 | Lycoming College PA | 1050–1270 | 1080–1300 | 45% | −30 | 20–27 | — |
| 344 | Montana State MT | 1050–1270 | 1065–1285 | 27% | −15 | 20–27 | — |
| 345 | North Central IL | 1030–1290 | 1055–1310 | 47% | −23 | 20–27 | — |
| 346 | Oglethorpe University GA | 1080–1240 | 1120–1280 | 20.3% | −40 | 21–26 | — |
| 347 | Polytechnic Institute NY | 990–1330 | 1025–1370 | 25% | −38 | 19–29 | — |
| 348 | Presbyterian College SC | 1120–1200 | 1155–1240 | 13.2% | −38 | 22–25 | — |
| 349 | Rider NJ | 1050–1270 | 1100–1320 | 17% | −50 | 20–27 | — |
| 350 | Saint Michael's College VT | 1080–1240 | 1120–1280 | 19% | −40 | 21–26 | — |
| 351 | South Dakota SD | 1100–1220 | 1145–1260 | 4.2% | −43 | 22–25 | — |
| 352 | University of Kentucky KY | 1050–1270 | 1070–1290 | 9% | −20 | 20–27 | — |
| 353 | University of North Florida† FL | 1060–1260 | 1070–1270 | 69% | −10 | 21–27 | — |
| 354 | ACU† TX | 1050–1260 | 1070–1270 | 49% | −15 | 20–27 | — |
| 355 | Hanover College IN | 1070–1240 | 1110–1280 | 21% | −40 | 21–26 | — |
| 356 | Montana† MT | 1070–1240 | 1110–1280 | 8.9% | −40 | 21–26 | — |
| 357 | Mount Vernon Nazarene OH | 1020–1290 | 1046–1315 | 12% | −26 | 19–27 | — |
| 358 | Nazareth NY | 1030–1280 | 1070–1320 | 29% | −40 | 20–27 | — |
| 359 | Nova Southeastern† FL | 1020–1290 | 1030–1300 | 48% | −10 | 19–27 | — |
| 360 | Old Dominion VA | 1080–1230 | 1120–1270 | 6.8% | −40 | 21–26 | — |
| 361 | Ouachita Baptist AR | 1050–1260 | 1070–1280 | 14% | −20 | 20–27 | — |
| 362 | Texas Tech University TX | 1080–1230 | 1110–1260 | 34.8% | −30 | 21–26 | — |
| 363 | USAO OK | 1060–1250 | 1090–1280 | 9% | −30 | 21–26 | — |
| 364 | UW Bothell WA | 990–1320 | 1030–1360 | 14.9% | −40 | 19–28 | — |
| 365 | Western New England MA | 1050–1260 | 1090–1300 | 22% | −40 | 20–27 | — |
| 366 | Brockport NY | 1060–1240 | 1100–1280 | 21% | −40 | 21–26 | — |
| 367 | Guilford NC | 1080–1220 | 1120–1260 | 10% | −40 | 21–25 | — |
| 368 | Harding† AR | 1030–1270 | 1050–1290 | 18% | −20 | 20–27 | — |
| 369 | Molloy NY | 1050–1250 | 1088–1290 | 22% | −39 | 20–26 | — |
| 370 | Ohio University OH | 1060–1240 | 1100–1280 | 12.5% | −40 | 21–26 | — |
| 371 | Saint Anselm College NH | 1070–1230 | 1110–1278 | 20% | −44 | 21–26 | — |
| 372 | Samford University AL | 1060–1240 | 1070–1250 | 26% | −10 | 21–26 | — |
| 373 | Southern Adventist TN | 1010–1290 | 1020–1300 | 42% | −10 | 19–27 | — |
| 374 | Suffolk MA | 1040–1260 | 1090–1300 | 18% | −45 | 20–27 | — |
| 375 | University of Massachusetts–Boston MA | 1040–1260 | 1070–1290 | 28% | −30 | 20–27 | — |
| 376 | University of Nebraska – Lincoln NE | 1030–1270 | 1070–1310 | 7.4% | −40 | 20–27 | — |
| 377 | Canisius NY | 1010–1280 | 1050–1320 | 29% | −40 | 19–27 | — |
| 378 | Christopher Newport University VA | 1030–1260 | 1060–1290 | 40% | −30 | 20–27 | — |
| 379 | College of Idaho† ID | 1040–1250 | 1070–1280 | 41% | −30 | 20–26 | — |
| 380 | Eastern Connecticut State University CT | 1050–1240 | 1070–1260 | 62% | −20 | 20–26 | — |
| 381 | Maine Maritime Academy ME | 1060–1230 | 1095–1260 | 34% | −33 | 21–26 | — |
| 382 | New College of Florida† FL | 1050–1240 | 1060–1245 | 74% | −8 | 20–26 | — |
| 383 | UIC IL | 1010–1280 | 1030–1300 | 46.6% | −20 | 19–27 | — |
| 384 | University of Oregon OR | 1010–1280 | 1050–1320 | 10.7% | −40 | 19–27 | — |
| 385 | Wayne State University† MI | 1040–1250 | 1060–1270 | 53% | −20 | 20–26 | — |
| 386 | West Chester University of Pennsylvania PA | 1070–1220 | 1110–1260 | 12.1% | −40 | 21–25 | — |
| 387 | William Jewell MO | 1050–1240 | 1080–1270 | 4% | −30 | 20–26 | — |
| 388 | Framingham State MA | 1050–1230 | 1100–1280 | 17% | −50 | 20–26 | — |
| 389 | Hartwick NY | 1030–1250 | 1070–1290 | 8% | −40 | 20–26 | — |
| 390 | Hollins VA | 1070–1210 | 1110–1250 | 14% | −40 | 21–25 | — |
| 391 | Howard DC | 1030–1250 | 1050–1270 | 46.7% | −20 | 20–26 | — |
| 392 | Moravian PA | 1030–1250 | 1070–1285 | 22% | −38 | 20–26 | — |
| 393 | South Dakota State SD | 1050–1230 | 1060–1240 | 3% | −10 | 20–26 | — |
| 394 | St Bonaventure NY | 1030–1250 | 1065–1290 | 24% | −38 | 20–26 | — |
| 395 | St. Joseph's NY NY | 1060–1220 | 1110–1270 | 14% | −50 | 21–25 | — |
| 396 | UMaine ME | 1020–1260 | 1060–1300 | 15.2% | −40 | 19–27 | — |
| 397 | Utah State† UT | 1030–1250 | 1070–1290 | 14% | −40 | 20–26 | — |
| 398 | Valparaiso IN | 1030–1250 | 1060–1280 | 38.7% | −30 | 20–26 | — |
| 399 | Alvernia PA | 1040–1230 | 1093–1286 | 7% | −55 | 20–26 | — |
| 400 | Ball State University IN | 1050–1220 | 1080–1260 | 30% | −35 | 20–25 | — |
| 401 | Bradley University IL | 1020–1250 | 1050–1280 | 40% | −30 | 19–26 | — |
| 402 | Catawba NC | 1060–1210 | 1100–1250 | 17.4% | −40 | 21–25 | — |
| 403 | Chatham University PA | 1040–1230 | 1080–1270 | 22.4% | −40 | 20–26 | — |
| 404 | Georgia College† GA | 1050–1220 | 1070–1230 | 73% | −15 | 20–25 | — |
| 405 | Oklahoma Baptist OK | 1050–1220 | 1070–1240 | 17% | −20 | 20–25 | — |
| 406 | Rutgers–Camden NJ | 1010–1260 | 1050–1300 | 34% | −40 | 19–27 | — |
| 407 | UMSL† MO | 1020–1250 | 1060–1290 | 10% | −40 | 19–26 | — |
| 408 | UW–Eau Claire WI | 1020–1250 | 1050–1280 | 1.3% | −30 | 19–26 | — |
| 409 | Western Carolina NC | 1040–1230 | 1080–1270 | 9% | −40 | 20–26 | — |
| 410 | Widener PA | 1030–1240 | 1080–1290 | 17% | −50 | 20–26 | — |
| 411 | Augustana College IL | 1000–1260 | 1020–1280 | 48.9% | −20 | 19–27 | — |
| 412 | LeTourneau TX | 960–1300 | 990–1330 | 35% | −30 | 18–28 | — |
| 413 | Montana Technological MT | 1020–1240 | 1040–1260 | 11% | −20 | 19–26 | — |
| 414 | Temple University PA | 990–1270 | 1030–1310 | 18.9% | −40 | 19–27 | — |
| 415 | University of Hawaii at Manoa HI | 1020–1240 | 1081–1293 | 1% | −57 | 19–26 | — |
| 416 | University of Nevada–Reno NV | 1020–1240 | 1060–1280 | 15.8% | −40 | 19–26 | — |
| 417 | Wilkes PA | 1020–1240 | 1065–1280 | 6.4% | −43 | 19–26 | — |
| 418 | Carroll MT | 1000–1250 | 1050–1300 | 5% | −50 | 19–26 | — |
| 419 | Centenary College LA | 1050–1200 | 1060–1210 | 16% | −10 | 20–25 | — |
| 420 | College of St. Benedict MN | 1030–1220 | 1048–1233 | 3% | −16 | 20–25 | — |
| 421 | FDU Florham NJ | 990–1260 | 1040–1310 | 18% | −50 | 19–27 | — |
| 422 | Husson ME | 1020–1230 | 1065–1275 | 14% | −45 | 19–26 | — |
| 423 | Marywood PA | 1030–1220 | 1060–1250 | 29% | −30 | 20–25 | — |
| 424 | Methodist NC | 1040–1210 | 1080–1250 | 11% | −40 | 20–25 | — |
| 425 | Oswego NY | 1030–1220 | 1070–1270 | 30% | −45 | 20–25 | — |
| 426 | UW–Stevens Point WI | 1000–1250 | 1040–1290 | 3.1% | −40 | 19–26 | — |
| 427 | Andrews MI | 970–1270 | 990–1290 | 39% | −20 | 18–27 | — |
| 428 | Arcadia PA | 1020–1220 | 1065–1265 | 22% | −45 | 19–25 | — |
| 429 | Kansas State University KS | 1020–1220 | 1060–1260 | 6.7% | −40 | 19–25 | — |
| 430 | Mount St. Mary's MD | 1000–1240 | 1046–1280 | 22% | −43 | 19–26 | — |
| 431 | North Greenville SC | 1030–1210 | 1060–1240 | 31% | −30 | 20–25 | — |
| 432 | St. Norbert College† WI | 990–1250 | 1033–1290 | 5% | −42 | 19–26 | — |
| 433 | University of Detroit Mercy MI | 1010–1230 | 1030–1250 | 51% | −20 | 19–26 | — |
| 434 | Virginia Military Institute VA | 1010–1230 | 1050–1270 | 17% | −40 | 19–26 | — |
| 435 | Walsh OH | 1000–1240 | 1040–1280 | 2% | −40 | 19–26 | — |
| 436 | Wyoming WY | 1000–1240 | 1040–1280 | 14.7% | −40 | 19–26 | — |
| 437 | Belhaven MS | 970–1260 | 1010–1298 | 1% | −39 | 18–27 | — |
| 438 | Bridgewater State MA | 1010–1220 | 1060–1263 | 14% | −47 | 19–25 | — |
| 439 | Carroll (WI) WI | 1000–1230 | 1040–1270 | 6% | −40 | 19–26 | — |
| 440 | College of the Ozarks† MO | 1030–1200 | 1050–1220 | 11% | −20 | 20–25 | — |
| 441 | Kent State University OH | 1000–1230 | 1010–1240 | 20% | −10 | 19–26 | — |
| 442 | Missouri State MO | 990–1240 | 1020–1270 | 6% | −30 | 19–26 | — |
| 443 | Morehead State KY | 1000–1230 | 1003–1233 | 4% | −3 | 19–26 | — |
| 444 | Nebraska Wesleyan NE | 980–1250 | 1020–1290 | 3% | −40 | 18–26 | — |
| 445 | Oklahoma City OK | 1010–1220 | 1050–1260 | 1% | −40 | 19–25 | — |
| 446 | Oklahoma State University OK | 1020–1210 | 1060–1250 | 16.8% | −40 | 19–25 | — |
| 447 | Plattsburgh NY | 1030–1200 | 1080–1250 | 15% | −50 | 20–25 | — |
| 448 | Randolph College VA | 1060–1170 | 1100–1210 | 14% | −40 | 21–24 | — |
| 449 | UMass Dartmouth MA | 1010–1220 | 1050–1260 | 9.9% | −40 | 19–25 | — |
| 450 | Farmingdale State NY | 1010–1210 | 1040–1240 | 39% | −30 | 19–25 | — |
| 451 | Lawrence Technological MI | 1000–1220 | 1030–1250 | 44.7% | −30 | 19–25 | — |
| 452 | Niagara NY | 1020–1200 | 1060–1235 | 30% | −38 | 19–25 | — |
| 453 | Northwest Nazarene ID | 990–1230 | 1005–1240 | 55% | −13 | 19–26 | — |
| 454 | Piedmont GA | 1010–1210 | 1038–1245 | 33% | −32 | 19–25 | — |
| 455 | Saint Francis PA | 1020–1200 | 1050–1230 | 43% | −30 | 19–25 | — |
| 456 | SCAD† GA | 990–1230 | 1030–1270 | 22% | −40 | 19–26 | — |
| 457 | University of Texas–Arlington TX | 990–1230 | 1010–1240 | 61% | −15 | 19–26 | — |
| 458 | Winona State MN | 980–1240 | 1000–1270 | 1% | −25 | 18–26 | — |
| 459 | Youngstown State OH | 1000–1220 | 1010–1230 | 14% | −10 | 19–25 | — |
| 460 | Coastal Carolina SC | 1030–1180 | 1060–1210 | 29.3% | −30 | 20–24 | — |
| 461 | Evergreen State WA | 1000–1210 | 1035–1253 | 6.1% | −39 | 19–25 | — |
| 462 | Fitchburg State MA | 1020–1190 | 1060–1230 | 19% | −40 | 19–24 | — |
| 463 | Georgia State University† GA | 1000–1210 | 1030–1240 | 40.7% | −30 | 19–25 | — |
| 464 | Indiana University Indianapolis IN | 1000–1210 | 1030–1240 | 31% | −30 | 19–25 | — |
| 465 | NAU AZ | 970–1240 | 1010–1280 | 3.4% | −40 | 18–26 | — |
| 466 | Saint Vincent College PA | 1000–1210 | 1020–1230 | 53% | −20 | 19–25 | — |
| 467 | St Francis IL | 1010–1200 | 1030–1220 | 56% | −20 | 19–25 | — |
| 468 | Virginia Commonwealth University VA | 980–1230 | 1010–1260 | 33.7% | −30 | 18–26 | — |
| 469 | Converse SC | 980–1220 | 1010–1250 | 30% | −30 | 18–25 | — |
| 470 | East Carolina University NC | 1020–1180 | 1060–1220 | 10% | −40 | 19–24 | — |
| 471 | Hampden-Sydney College VA | 990–1210 | 1030–1250 | 22% | −40 | 19–25 | — |
| 472 | Kennesaw State† GA | 990–1210 | 1000–1220 | 65% | −10 | 19–25 | — |
| 473 | Pacific Lutheran University WA | 990–1210 | 1040–1260 | 4% | −50 | 19–25 | — |
| 474 | San Jose State University CA | 970–1230 | 1010–1270 | 9% | −40 | 18–26 | — |
| 475 | Seton Hill PA | 990–1210 | 1020–1240 | 40% | −30 | 19–25 | — |
| 476 | University of Idaho ID | 980–1220 | 990–1230 | 65% | −10 | 18–25 | — |
| 477 | University of Michigan–Dearborn MI | 970–1230 | 990–1255 | 56% | −23 | 18–26 | — |
| 478 | University of Texas–San Antonio TX | 1000–1200 | 1010–1210 | 61% | −10 | 19–25 | — |
| 479 | Washington & Jefferson College PA | 980–1220 | 1010–1250 | 42% | −30 | 18–25 | — |
| 480 | West Virginia University WV | 1000–1200 | 1010–1210 | 64.4% | −10 | 19–25 | — |
| 481 | Ashland OH | 1010–1180 | 1035–1208 | 8% | −27 | 19–24 | — |
| 482 | Elmhurst IL | 960–1230 | 990–1260 | 32% | −30 | 18–26 | — |
| 483 | Nichols MA | 990–1200 | 1028–1236 | 18% | −37 | 19–25 | — |
| 484 | Point Park† PA | 990–1200 | 1030–1245 | 24% | −43 | 19–25 | — |
| 485 | Spring Arbor MI | 980–1210 | 1010–1240 | 29% | −30 | 18–25 | — |
| 486 | University of Arkansas AR | 1000–1190 | 1030–1220 | 31% | −30 | 19–24 | — |
| 487 | Worcester State MA | 1020–1170 | 1060–1210 | 14.4% | −40 | 19–24 | — |
| 488 | Lee TN | 990–1190 | 1030–1230 | 21.4% | −40 | 19–24 | — |
| 489 | Loyola New Orleans† LA | 990–1190 | 1030–1230 | 6% | −40 | 19–24 | — |
| 490 | Marietta OH | 1010–1170 | 1040–1200 | 18% | −30 | 19–24 | — |
| 491 | Regis CO | 990–1190 | 1020–1220 | 30% | −30 | 19–24 | — |
| 492 | Stockton NJ | 990–1190 | 1030–1230 | 28% | −40 | 19–24 | — |
| 493 | UM–Flint MI | 950–1230 | 970–1243 | 62% | −17 | 18–26 | — |
| 494 | Bellarmine KY | 990–1180 | 1030–1225 | 8% | −43 | 19–24 | — |
| 495 | Lindenwood† MO | 980–1190 | 1023–1230 | 6% | −42 | 18–24 | — |
| 496 | Longwood VA | 990–1180 | 1030–1210 | 42% | −35 | 19–24 | — |
| 497 | MTSU† TN | 980–1190 | 1010–1230 | 8% | −35 | 18–24 | — |
| 498 | New Orleans LA | 930–1240 | 935–1241 | 5% | −3 | 17–26 | — |
| 499 | North Georgia† GA | 970–1200 | 980–1210 | 69% | −10 | 18–25 | — |
| 500 | Trevecca Nazarene TN | 960–1210 | 980–1235 | 19% | −23 | 18–25 | — |
| 501 | University of Nevada–Las Vegas† NV | 970–1200 | 1010–1240 | 9% | −40 | 18–25 | — |
| 502 | Winthrop SC | 980–1190 | 1010–1220 | 36% | −30 | 18–24 | — |
| 503 | Bryn Athyn College of the New Church PA | 940–1220 | 980–1253 | 36% | −37 | 17–25 | — |
| 504 | Illinois State University IL | 980–1180 | 1010–1210 | 43.7% | −30 | 18–24 | — |
| 505 | Northwest Missouri MO | 970–1190 | 976–1193 | 2% | −5 | 18–24 | — |
| 506 | Regent† VA | 950–1210 | 990–1250 | 10% | −40 | 18–25 | — |
| 507 | Southern Maine ME | 950–1210 | 990–1250 | 21% | −40 | 18–25 | — |
| 508 | Toccoa Falls GA | 970–1190 | 1010–1230 | 19% | −40 | 18–24 | — |
| 509 | University of Louisville KY | 970–1190 | 1010–1230 | 18.2% | −40 | 18–24 | — |
| 510 | Utica NY | 950–1210 | 990–1250 | 15% | −40 | 18–25 | — |
| 511 | ETSU TN | 970–1180 | 980–1200 | 9% | −15 | 18–24 | — |
| 512 | Huntingdon AL | 970–1180 | 1006–1220 | 3% | −38 | 18–24 | — |
| 513 | Lincoln Memorial TN | 970–1180 | 1000–1210 | 10% | −30 | 18–24 | — |
| 514 | LSU Alexandria† LA | 950–1200 | 970–1220 | 5% | −20 | 18–25 | — |
| 515 | Mercy NY | 970–1180 | 1020–1230 | 4% | −50 | 18–24 | — |
| 516 | Mississippi State University† MS | 960–1190 | 1000–1230 | 7.3% | −40 | 18–24 | — |
| 517 | North Carolina Agricultural and Technical State University NC | 990–1160 | 1020–1190 | 29% | −30 | 19–24 | — |
| 518 | North Dakota State University ND | 950–1200 | 968–1216 | 1% | −17 | 18–25 | — |
| 519 | Purdue Fort Wayne IN | 960–1190 | 970–1220 | 56% | −20 | 18–24 | — |
| 520 | University of North Texas TX | 950–1200 | 980–1230 | 42% | −30 | 18–25 | — |
| 521 | UT Chattanooga† TN | 980–1170 | 1013–1210 | 5% | −37 | 18–24 | — |
| 522 | UT Tyler TX | 980–1170 | 1010–1200 | 40% | −30 | 18–24 | — |
| 523 | Azusa Pacific CA | 940–1200 | 983–1238 | 13% | −41 | 17–25 | — |
| 524 | Carthage WI | 960–1180 | 980–1200 | 20% | −20 | 18–24 | — |
| 525 | Hardin-Simmons TX | 980–1160 | 1010–1190 | 29% | −30 | 18–24 | — |
| 526 | LSU Shreveport LA | 970–1170 | 1000–1195 | 2% | −28 | 18–24 | — |
| 527 | Randolph-Macon College VA | 950–1190 | 980–1220 | 45% | −30 | 18–24 | — |
| 528 | South Carolina Aiken SC | 950–1190 | 980–1220 | 30% | −30 | 18–24 | — |
| 529 | Toledo OH | 940–1200 | 980–1245 | 18.7% | −43 | 17–25 | — |
| 530 | University of the Ozarks AR | 1000–1140 | 1020–1160 | 26% | −20 | 19–23 | — |
| 531 | Wingate NC | 970–1170 | 1010–1210 | 15% | −40 | 18–24 | — |
| 532 | Akron† OH | 940–1190 | 980–1230 | 18% | −40 | 17–24 | — |
| 533 | Lynchburg VA | 940–1190 | 980–1230 | 18% | −40 | 17–24 | — |
| 534 | Lynn FL | 990–1140 | 1040–1200 | 12% | −55 | 19–23 | — |
| 535 | St. Edward's TX | 930–1200 | 970–1240 | 21% | −40 | 17–25 | — |
| 536 | Texas A&M–CC TX | 960–1170 | 980–1190 | 48.8% | −20 | 18–24 | — |
| 537 | Texas State TX | 960–1170 | 990–1200 | 41.1% | −30 | 18–24 | — |
| 538 | WestConn CT | 1000–1130 | 1040–1170 | 32% | −40 | 19–23 | — |
| 539 | Wichita State KS | 900–1230 | 905–1240 | 8% | −8 | 16–26 | — |
| 540 | Buffalo State NY | 930–1190 | 980–1240 | 14% | −50 | 17–24 | — |
| 541 | Carson-Newman TN | 930–1190 | 955–1215 | 10% | −25 | 17–24 | — |
| 542 | Central Michigan MI | 940–1180 | 960–1200 | 49% | −20 | 17–24 | — |
| 543 | D'Youville University NY | 950–1170 | 995–1220 | 16% | −48 | 18–24 | — |
| 544 | Dubuque IA | 940–1180 | 980–1220 | 14% | −40 | 17–24 | — |
| 545 | Grace IN | 960–1160 | 1000–1200 | 21% | −40 | 18–24 | — |
| 546 | Hawaii Pacific HI | 960–1160 | 998–1200 | 18% | −39 | 18–24 | — |
| 547 | Millsaps College† MS | 1000–1120 | 1025–1150 | 4% | −28 | 19–22 | — |
| 548 | Quincy IL | 960–1160 | 1000–1200 | 11.2% | −40 | 18–24 | — |
| 549 | Shippensburg PA | 940–1180 | 980–1210 | 39% | −35 | 17–24 | — |
| 550 | Southeast Missouri MO | 950–1170 | 990–1210 | 8.5% | −40 | 18–24 | — |
| 551 | SUNY College–Old Westbury NY | 960–1160 | 1010–1206 | 12% | −48 | 18–24 | — |
| 552 | Tarleton TX | 970–1150 | 980–1160 | 53% | −10 | 18–23 | — |
| 553 | UCCS CO | 960–1160 | 1010–1220 | 2% | −55 | 18–24 | — |
| 554 | University of Colorado Denver† CO | 940–1180 | 980–1220 | 23.7% | −40 | 17–24 | — |
| 555 | Western Michigan MI | 940–1180 | 960–1200 | 50.1% | −20 | 17–24 | — |
| 556 | Arkansas Little Rock† AR | 930–1180 | 960–1210 | 6% | −30 | 17–24 | — |
| 557 | Dallas Baptist TX | 930–1180 | 960–1213 | 32% | −32 | 17–24 | — |
| 558 | Dillard University LA | 940–1170 | 968–1202 | 10% | −30 | 17–24 | — |
| 559 | Palm Beach Atlantic FL | 920–1190 | 950–1220 | 28% | −30 | 17–24 | — |
| 560 | Saint Johns University MN | 910–1200 | 941–1228 | 4% | −30 | 17–25 | — |
| 561 | Slippery Rock University of Pennsylvania† PA | 960–1150 | 1000–1190 | 11.5% | −40 | 18–23 | — |
| 562 | Southeastern Oklahoma State OK | 950–1160 | 980–1186 | 12% | −28 | 18–24 | — |
| 563 | Tuskegee AL | 930–1180 | 970–1215 | 8% | −38 | 17–24 | — |
| 564 | University of La Verne CA | 930–1180 | 986–1236 | 6% | −56 | 17–24 | — |
| 565 | University of St. Thomas (TX)† TX | 940–1170 | 980–1210 | 15% | −40 | 17–24 | — |
| 566 | Central IA | 1020–1080 | 1056–1120 | 8% | −38 | 19–21 | — |
| 567 | Gardner-Webb NC | 940–1160 | 975–1198 | 16% | −37 | 17–24 | — |
| 568 | Georgia Southern GA | 980–1120 | 986–1133 | 71% | −10 | 18–22 | — |
| 569 | Houston Christian TX | 950–1150 | 990–1190 | 21% | −40 | 18–23 | — |
| 570 | Indiana Wesleyan IN | 940–1160 | 960–1180 | 46% | −20 | 17–24 | — |
| 571 | Lasell MA | 990–1110 | 1030–1158 | 8% | −44 | 19–22 | — |
| 572 | Mary Hardin-Baylor TX | 930–1170 | 960–1200 | 39% | −30 | 17–24 | — |
| 573 | McPherson KS | 930–1170 | 960–1200 | 24% | −30 | 17–24 | — |
| 574 | SIU Edwardsville IL | 930–1170 | 950–1190 | 49% | −20 | 17–24 | — |
| 575 | Towson MD | 910–1190 | 950–1235 | 21% | −43 | 17–24 | — |
| 576 | UT Martin† TN | 930–1170 | 970–1210 | 2% | −40 | 17–24 | — |
| 577 | Waynesburg PA | 890–1210 | 930–1250 | 17% | −40 | 16–25 | — |
| 578 | Alfred State NY | 940–1150 | 990–1200 | 16% | −50 | 17–23 | — |
| 579 | IU Southeast IN | 940–1150 | 970–1180 | 30% | −30 | 17–23 | — |
| 580 | Lewis† IL | 920–1170 | 960–1210 | 25% | −40 | 17–24 | — |
| 581 | McNeese State† LA | 920–1170 | 940–1198 | 9% | −24 | 17–24 | — |
| 582 | Mount Saint Vincent NY | 960–1130 | 1011–1178 | 3% | −50 | 18–23 | — |
| 583 | Saint Leo† FL | 940–1150 | 980–1190 | 8% | −40 | 17–23 | — |
| 584 | UNC Pembroke NC | 930–1160 | 970–1200 | 3.8% | −40 | 17–24 | — |
| 585 | University of Mississippi MS | 950–1140 | 990–1175 | 26.7% | −38 | 18–23 | — |
| 586 | USC Upstate SC | 960–1130 | 1005–1175 | 6% | −45 | 18–23 | — |
| 587 | Boise State ID | 930–1150 | 960–1180 | 49% | −30 | 17–23 | — |
| 588 | Eastern Michigan MI | 920–1160 | 920–1170 | 68% | −5 | 17–24 | — |
| 589 | Illinois Springfield IL | 910–1170 | 940–1200 | 40% | −30 | 17–24 | — |
| 590 | Jax State AL | 910–1170 | 950–1210 | 4.6% | −40 | 17–24 | — |
| 591 | Lander SC | 920–1160 | 950–1178 | 39% | −24 | 17–24 | — |
| 592 | Lubbock Christian TX | 920–1160 | 950–1190 | 30% | −30 | 17–24 | — |
| 593 | NKU KY | 940–1140 | 953–1150 | 8% | −12 | 17–23 | — |
| 594 | Northern Colorado† CO | 920–1160 | 950–1190 | 36% | −30 | 17–24 | — |
| 595 | Northern State SD | 950–1130 | 980–1160 | 1% | −30 | 18–23 | — |
| 596 | South Alabama† AL | 930–1150 | 970–1190 | 7% | −40 | 17–23 | — |
| 597 | Stetson University FL | 920–1160 | 945–1190 | 33.3% | −28 | 17–24 | — |
| 598 | Wright State OH | 870–1210 | 910–1250 | 4.2% | −40 | 16–25 | — |
| 599 | BYU-Hawaii† HI | 920–1150 | 960–1190 | 8% | −40 | 17–23 | — |
| 600 | Capital OH | 900–1170 | 910–1180 | 16% | −10 | 16–24 | — |
| 601 | Charleston Southern† SC | 920–1150 | 930–1160 | 56% | −10 | 17–23 | — |
| 602 | Flagler FL | 920–1150 | 960–1190 | 24% | −40 | 17–23 | — |
| 603 | IUP PA | 930–1140 | 970–1180 | 24.6% | −40 | 17–23 | — |
| 604 | Midland NE | 930–1140 | 963–1170 | 7% | −32 | 17–23 | — |
| 605 | University of Hawaii at Hilo HI | 920–1150 | 945–1175 | 19% | −25 | 17–23 | — |
| 606 | West Florida† FL | 940–1130 | 970–1160 | 41.4% | −30 | 17–23 | — |
| 607 | IU South Bend IN | 910–1150 | 950–1190 | 27% | −40 | 17–23 | — |
| 608 | Marshall† WV | 930–1130 | 940–1140 | 70.5% | −10 | 17–23 | — |
| 609 | Maryville MO | 930–1130 | 965–1165 | 8% | −35 | 17–23 | — |
| 610 | Texas Wesleyan TX | 990–1070 | 1020–1100 | 31% | −30 | 19–21 | — |
| 611 | Texas Woman's TX | 940–1120 | 970–1150 | 41.1% | −30 | 17–22 | — |
| 612 | UW Tacoma WA | 900–1160 | 940–1200 | 16.3% | −40 | 16–24 | — |
| 613 | Brenau GA | 890–1160 | 930–1200 | 12% | −40 | 16–24 | — |
| 614 | Colorado Mesa CO | 910–1140 | 930–1160 | 49% | −20 | 17–23 | — |
| 615 | Fort Hays State KS | 940–1110 | 970–1140 | 5% | −30 | 17–22 | — |
| 616 | Grand Valley State MI | 900–1150 | 920–1170 | 54.2% | −20 | 16–23 | — |
| 617 | IU East IN | 920–1130 | 960–1170 | 23% | −40 | 17–23 | — |
| 618 | IU Kokomo IN | 930–1120 | 960–1150 | 38% | −30 | 17–22 | — |
| 619 | Malone OH | 900–1150 | 930–1180 | 11% | −30 | 16–23 | — |
| 620 | Mount Union OH | 860–1190 | 910–1240 | 1% | −50 | 15–24 | — |
| 621 | University of New Mexico† NM | 900–1150 | 920–1170 | 55% | −20 | 16–23 | — |
| 622 | West Georgia GA | 930–1120 | 950–1140 | 59% | −20 | 17–22 | — |
| 623 | Georgetown College† KY | 920–1120 | 960–1160 | 3% | −40 | 17–22 | — |
| 624 | Huntington IN | 910–1130 | 930–1150 | 59% | −20 | 17–23 | — |
| 625 | Pacific University OR | 850–1190 | 900–1240 | 8% | −50 | 15–24 | — |
| 626 | McMurry TX | 910–1120 | 950–1160 | 13% | −40 | 17–22 | — |
| 627 | Murray State KY | 900–1130 | 940–1170 | 17% | −40 | 16–23 | — |
| 628 | Central Arkansas AR | 880–1140 | 910–1170 | 4% | −30 | 16–23 | — |
| 629 | Memphis† TN | 880–1140 | 915–1180 | 3% | −38 | 16–23 | — |
| 630 | Nebraska Kearney NE | 900–1120 | 905–1125 | 4% | −5 | 16–22 | — |
| 631 | SFA† TX | 920–1100 | 950–1130 | 47.7% | −30 | 17–22 | — |
| 632 | Texas A&M–Kingsville TX | 950–1070 | 990–1110 | 27% | −40 | 18–21 | — |
| 633 | Illinois College IL | 860–1150 | 883–1180 | 47% | −27 | 15–23 | — |
| 634 | IU Northwest IN | 870–1140 | 910–1180 | 29% | −40 | 16–23 | — |
| 635 | Lamar TX | 900–1110 | 930–1140 | 41.4% | −30 | 16–22 | — |
| 636 | Mount St. Joseph OH | 900–1110 | 930–1140 | 14% | −30 | 16–22 | — |
| 637 | Radford VA | 910–1100 | 950–1140 | 11.3% | −40 | 17–22 | — |
| 638 | Saint Joseph's (ME) ME | 910–1100 | 960–1150 | 7% | −50 | 17–22 | — |
| 639 | SIU Carbondale IL | 860–1150 | 890–1180 | 39% | −30 | 15–23 | — |
| 640 | Wilmington OH | 820–1190 | 850–1220 | 5% | −30 | 14–24 | — |
| 641 | Bridgeport CT | 890–1110 | 935–1160 | 14% | −48 | 16–22 | — |
| 642 | Keene State NH | 810–1190 | 860–1240 | 6% | −50 | 14–24 | — |
| 643 | NM State NM | 870–1130 | 900–1160 | 48.6% | −30 | 16–23 | — |
| 644 | Valdosta State GA | 910–1090 | 920–1100 | 56% | −10 | 17–21 | — |
| 645 | Anderson (IN)† IN | 870–1120 | 900–1150 | 40% | −30 | 16–22 | — |
| 646 | East Texas A&M† TX | 880–1110 | 910–1140 | 42.8% | −30 | 16–22 | — |
| 647 | FDU Metropolitan NJ | 860–1130 | 908–1180 | 12% | −49 | 15–23 | — |
| 648 | Ferris State† MI | 880–1110 | 890–1120 | 63% | −10 | 16–22 | — |
| 649 | Friends KS | 930–1060 | 960–1090 | 15% | −30 | 17–21 | — |
| 650 | Mount Aloysius PA | 870–1120 | 918–1168 | 10% | −48 | 16–22 | — |
| 651 | Purdue Northwest† IN | 870–1120 | 890–1140 | 50% | −20 | 16–22 | — |
| 652 | Sam Houston TX | 900–1090 | 930–1120 | 45.1% | −30 | 16–21 | — |
| 653 | Aurora IL | 860–1120 | 900–1160 | 18% | −40 | 15–22 | — |
| 654 | Averett VA | 880–1100 | 926–1143 | 8% | −45 | 16–22 | — |
| 655 | Central Connecticut† CT | 870–1110 | 900–1140 | 42.6% | −30 | 16–22 | — |
| 656 | East Central OK | 880–1100 | 900–1120 | 3% | −20 | 16–22 | — |
| 657 | Eastern Illinois IL | 870–1110 | 890–1130 | 50.4% | −20 | 16–22 | — |
| 658 | Howard Payne TX | 850–1130 | 880–1160 | 26% | −30 | 15–23 | — |
| 659 | Indiana State IN | 880–1100 | 890–1110 | 71.3% | −10 | 16–22 | — |
| 660 | Kean NJ | 880–1100 | 930–1150 | 13% | −50 | 16–22 | — |
| 661 | MidAmerica Nazarene KS | 920–1060 | 950–1090 | 9% | −30 | 17–21 | — |
| 662 | Roosevelt IL | 850–1130 | 895–1175 | 18% | −45 | 15–23 | — |
| 663 | UVA Wise VA | 900–1080 | 945–1120 | 12% | −43 | 16–21 | — |
| 664 | Western Kentucky KY | 890–1090 | 930–1130 | 9.3% | −40 | 16–21 | — |
| 665 | JWU Providence RI | 850–1120 | 890–1160 | 18% | −40 | 15–22 | — |
| 666 | Holy Family PA | 860–1100 | 910–1150 | 7% | −50 | 15–22 | — |
| 667 | Kentucky Wesleyan KY | 860–1100 | 890–1130 | 15% | −30 | 15–22 | — |
| 668 | Muskingum OH | 880–1080 | 910–1105 | 10% | −28 | 16–21 | — |
| 669 | Rocky Mountain MT | 860–1100 | 893–1133 | 8% | −33 | 15–22 | — |
| 670 | Eastern Kentucky KY | 870–1070 | 880–1080 | 3% | −10 | 16–21 | — |
| 671 | West Alabama AL | 840–1100 | 860–1120 | 4% | −20 | 15–22 | — |
| 672 | Adrian MI | 830–1100 | 873–1140 | 24% | −42 | 15–22 | — |
| 673 | Cal Baptist CA | 820–1110 | 860–1150 | 9.7% | −40 | 14–22 | — |
| 674 | Cleveland State† OH | 840–1090 | 880–1130 | 21% | −40 | 15–21 | — |
| 675 | Montclair State University NJ | 810–1120 | 850–1160 | 9.5% | −40 | 14–22 | — |
| 676 | Southern Arkansas† AR | 850–1080 | 875–1105 | 7% | −25 | 15–21 | — |
| 677 | Elizabeth City State NC | 880–1040 | 920–1080 | 10% | −40 | 16–20 | — |
| 678 | Fort Valley State† GA | 890–1030 | 930–1070 | 25% | −40 | 16–20 | — |
| 679 | Georgia Southwestern GA | 850–1070 | 890–1110 | 24% | −40 | 15–21 | — |
| 680 | Grambling LA | 880–1040 | 920–1080 | 8% | −40 | 16–20 | — |
| 681 | JWU Charlotte NC | 840–1080 | 880–1130 | 11% | −45 | 15–21 | — |
| 682 | Missouri Valley MO | 850–1070 | 895–1115 | 4% | −45 | 15–21 | — |
| 683 | Ottawa (AZ) AZ | 800–1120 | 840–1160 | 3% | −40 | 14–22 | — |
| 684 | TAMIU† TX | 860–1060 | 890–1090 | 41% | −30 | 15–21 | — |
| 685 | UTEP† TX | 850–1070 | 860–1080 | 58% | −10 | 15–21 | — |
| 686 | Angelo State TX | 820–1090 | 860–1130 | 28.9% | −40 | 14–21 | — |
| 687 | Dominican (IL) IL | 830–1080 | 870–1120 | 16.1% | −40 | 15–21 | — |
| 688 | Francis Marion SC | 830–1080 | 870–1115 | 19% | −38 | 15–21 | — |
| 689 | Millikin IL | 820–1090 | 860–1130 | 26% | −40 | 14–21 | — |
| 690 | St Catherine MN | 810–1100 | 850–1140 | 1% | −40 | 14–22 | — |
| 691 | William Penn IA | 840–1070 | 880–1110 | 16% | −40 | 15–21 | — |
| 692 | Clark Atlanta GA | 830–1070 | 880–1120 | 8% | −50 | 15–21 | — |
| 693 | UH–Downtown TX | 860–1030 | 880–1050 | 60.2% | −20 | 15–20 | — |
| 694 | UTRGV TX | 840–1050 | 880–1090 | 1% | −40 | 15–20 | — |
| 695 | Clayton State GA | 830–1050 | 860–1078 | 46% | −29 | 15–20 | — |
| 696 | Fayetteville State NC | 840–1040 | 890–1090 | 4% | −50 | 15–20 | — |
| 697 | Madonna MI | 840–1040 | 880–1080 | 31% | −40 | 15–20 | — |
| 698 | Rhode Island College RI | 820–1060 | 870–1120 | 15% | −55 | 14–21 | — |
| 699 | UAPB† AR | 810–1070 | 845–1108 | 14% | −37 | 14–21 | — |
| 700 | Bethel (TN) TN | 790–1080 | 830–1120 | 25% | −40 | 14–21 | — |
| 701 | Lewis-Clark State ID | 800–1060 | 850–1110 | 14% | −50 | 14–21 | — |
| 702 | NC Central NC | 770–1090 | 810–1130 | 1% | −40 | 13–21 | — |
| 703 | St. Thomas Aquinas NY | 830–1030 | 880–1085 | 0% | −53 | 15–20 | — |
| 704 | Eastern New Mexico NM | 810–1040 | 830–1060 | 56% | −20 | 14–20 | — |
| 705 | Hampton VA | 770–1070 | 790–1090 | 54% | −20 | 13–21 | — |
| 706 | California State University–Fullerton CA | 810–1020 | 850–1060 | 5.6% | −40 | 14–19 | — |
| 707 | Jackson State MS | 790–1040 | 820–1070 | 1% | −30 | 14–20 | — |
| 708 | Morgan State† MD | 800–1030 | 840–1070 | 29% | −40 | 14–20 | — |
| 709 | Virginia State VA | 800–1030 | 840–1070 | 18% | −40 | 14–20 | — |
| 710 | Alabama A&M AL | 790–1020 | 810–1040 | 69% | −20 | 14–19 | — |
| 711 | Coppin State MD | 830–970 | 880–1020 | 1% | −50 | 15–18 | — |
| 712 | Warner FL | 760–1040 | 790–1070 | 43% | −30 | 13–20 | — |
| 713 | Bethune-Cookman FL | 820–970 | 830–990 | 52% | −15 | 14–18 | — |
| 714 | Northwestern Oklahoma State† OK | 780–1010 | 803–1036 | 15% | −25 | 14–19 | — |
| 715 | Norfolk State VA | 780–990 | 823–1030 | 16% | −42 | 14–19 | — |
| 716 | Winston-Salem State NC | 790–980 | 830–1020 | 8% | −40 | 14–18 | — |
| 717 | Delaware State† DE | 770–990 | 800–1020 | 35% | −30 | 13–19 | — |
| 718 | Columbus State GA | 760–990 | 800–1030 | 12.6% | −40 | 13–19 | — |
| 719 | Benedict SC | 770–970 | 820–1020 | 16% | −50 | 13–18 | — |
| 720 | Bowie State MD | 750–990 | 800–1048 | 5% | −54 | 13–19 | — |
| 721 | Dakota State SD | 840–900 | 880–940 | 16.6% | −40 | 15–16 | — |
| 722 | Texas Southern TX | 770–970 | 800–1000 | 32% | −30 | 13–18 | — |
| 723 | Southern University† LA | 750–980 | 790–1020 | 17% | −40 | 13–18 | — |
| 724 | Gallaudet University† DC | 740–980 | 780–1022 | 24% | −41 | 13–18 | — |
| 725 | Lincoln (PA) PA | 790–930 | 820–960 | 38% | −30 | 14–17 | — |
| 726 | Ottawa (KS) KS | 710–960 | 750–1000 | 6% | −40 | 12–18 | — |
| 727 | Livingstone NC | 750–910 | 800–960 | 17% | −50 | 13–17 | — |
| 728 | Alabama State AL | 710–930 | 749–967 | 9% | −38 | 12–17 | — |
| 729 | Virginia Union VA | 800–830 | 850–885 | 5% | −53 | 14–15 | — |
| 730 | Alcorn State University† MS | 630–960 | 670–998 | 9% | −39 | 10–18 | — |
These are estimates. Colleges publish only the scores of students who sent them, and at test-optional colleges those students are usually the higher scorers, so the true middle of the class is lower than the reported range. The size of the adjustment is our estimate, not a college's figure. Compare your own scores with the adjusted range, and use the ACT column if you took the ACT: see your odds school by school. Colleges where 75% or more of students send SAT scores (Harvard and MIT, for example) need no adjustment and aren't listed. † marks colleges that now require tests but whose latest data covers a class admitted when tests were optional.