prefrosh.ai

College admissions data, 2026–27

Most selective colleges, 2026–27

Caltech has the lowest admit rate of the 1,000+ colleges we track at 2.6%; 8 colleges admit under 5% of applicants and 30 admit under 10%.

Last updated Oct 2026Admit rate: US Department of Education, IPEDS admissions survey, students entering fall 2024 (the latest federal year). Colleges with fewer than 500 applicants are left out.

Share of applicants admitted, lowest first
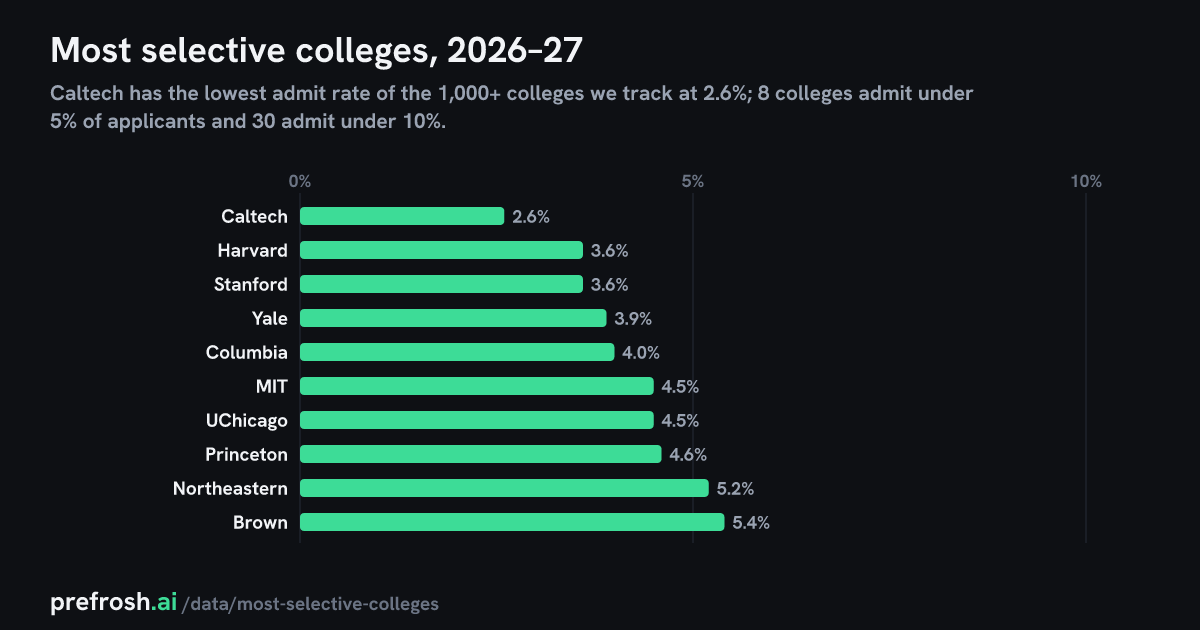
Admit rate, lowest firstBar chart of 50 colleges.0%2%4%6%8%10%12%14%Caltech: 2.6% of 13,856 applicants admittedCaltech2.6%Harvard: 3.6% of 54,008 applicants admittedHarvard3.6%Stanford: 3.6% of 57,326 applicants admittedStanford3.6%Yale: 3.9% of 57,517 applicants admittedYale3.9%Columbia: 4.0% of 60,115 applicants admittedColumbia4.0%MIT: 4.5% of 28,232 applicants admittedMIT4.5%UChicago: 4.5% of 43,612 applicants admittedUChicago4.5%Princeton: 4.6% of 40,468 applicants admittedPrinceton4.6%Northeastern: 5.2% of 98,425 applicants admittedNortheastern5.2%Brown: 5.4% of 48,904 applicants admittedBrown5.4%Dartmouth: 5.4% of 31,656 applicants admittedDartmouth5.4%Penn: 5.4% of 65,226 applicants admittedPenn5.4%Duke: 5.7% of 51,795 applicants admittedDuke5.7%Vanderbilt: 5.9% of 45,409 applicants admittedVanderbilt5.9%Johns Hopkins: 6.4% of 45,895 applicants admittedJohns Hopkins6.4%Bowdoin College: 7.1% of 13,265 applicants admittedBowdoin College7.1%Colby College: 7.1% of 19,187 applicants admittedColby College7.1%Pomona College: 7.1% of 12,249 applicants admittedPomona College7.1%Swarthmore College: 7.5% of 13,065 applicants admittedSwarthmore College7.5%Northwestern: 7.7% of 49,474 applicants admittedNorthwestern7.7%Rice: 8.0% of 32,473 applicants admittedRice8.0%Williams College: 8.3% of 15,411 applicants admittedWilliams College8.3%Barnard College: 8.8% of 11,836 applicants admittedBarnard College8.8%Cornell: 8.8% of 62,993 applicants admittedCornell8.8%Amherst College: 9.0% of 13,743 applicants admittedAmherst College9.0%UCLA: 9.0% of 146,272 applicants admittedUCLA9.0%NYU: 9.2% of 110,807 applicants admittedNYU9.2%United States Naval Academy: 9.3% of 15,149 applicants admittedUnited States Naval Aca…9.3%Claremont McKenna College: 9.6% of 6,529 applicants admittedClaremont McKenna Colle…9.6%USC: 9.8% of 82,027 applicants admittedUSC9.8%Emory: 10.6% of 33,450 applicants admittedEmory10.6%Middlebury College: 10.7% of 12,540 applicants admittedMiddlebury College10.7%UC Berkeley: 11.0% of 124,242 applicants admittedUC Berkeley11.0%Boston University: 11.1% of 78,769 applicants admittedBoston University11.1%Notre Dame: 11.3% of 29,942 applicants admittedNotre Dame11.3%Tufts: 11.5% of 34,432 applicants admittedTufts11.5%Carnegie Mellon: 11.7% of 33,941 applicants admittedCarnegie Mellon11.7%College of the Ozarks: 12.0% of 2,919 applicants admittedCollege of the Ozarks12.0%WashU: 12.1% of 32,754 applicants admittedWashU12.1%Haverford College: 12.4% of 7,341 applicants admittedHaverford College12.4%United States Military Academy at West Point: 12.5% of 12,320 applicants admittedUnited States Military …12.5%Harvey Mudd College: 12.7% of 5,094 applicants admittedHarvey Mudd College12.7%Georgetown: 12.9% of 26,131 applicants admittedGeorgetown12.9%Bates College: 13.3% of 10,027 applicants admittedBates College13.3%Davidson College: 13.4% of 8,114 applicants admittedDavidson College13.4%Hamilton College: 13.6% of 8,531 applicants admittedHamilton College13.6%Colgate University: 13.9% of 20,682 applicants admittedColgate University13.9%Tulane: 14.0% of 32,609 applicants admittedTulane14.0%Washington and Lee University: 14.0% of 8,213 applicants admittedWashington and Lee Univ…14.0%Wellesley College: 14.0% of 8,714 applicants admittedWellesley College14.0%
Admit rate, lowest firstBar chart of 50 colleges.0%4%8%12%16%Caltech: 2.6% of 13,856 applicants admittedCaltech2.6%Harvard: 3.6% of 54,008 applicants admittedHarvard3.6%Stanford: 3.6% of 57,326 applicants admittedStanford3.6%Yale: 3.9% of 57,517 applicants admittedYale3.9%Columbia: 4.0% of 60,115 applicants admittedColumbia4.0%MIT: 4.5% of 28,232 applicants admittedMIT4.5%UChicago: 4.5% of 43,612 applicants admittedUChicago4.5%Princeton: 4.6% of 40,468 applicants admittedPrinceton4.6%Northeastern: 5.2% of 98,425 applicants admittedNortheastern5.2%Brown: 5.4% of 48,904 applicants admittedBrown5.4%Dartmouth: 5.4% of 31,656 applicants admittedDartmouth5.4%Penn: 5.4% of 65,226 applicants admittedPenn5.4%Duke: 5.7% of 51,795 applicants admittedDuke5.7%Vanderbilt: 5.9% of 45,409 applicants admittedVanderbilt5.9%Johns Hopkins: 6.4% of 45,895 applicants admittedJohns Hopkins6.4%Bowdoin College: 7.1% of 13,265 applicants admittedBowdoin College7.1%Colby College: 7.1% of 19,187 applicants admittedColby College7.1%Pomona College: 7.1% of 12,249 applicants admittedPomona College7.1%Swarthmore College: 7.5% of 13,065 applicants admittedSwarthmore Coll…7.5%Northwestern: 7.7% of 49,474 applicants admittedNorthwestern7.7%Rice: 8.0% of 32,473 applicants admittedRice8.0%Williams College: 8.3% of 15,411 applicants admittedWilliams College8.3%Barnard College: 8.8% of 11,836 applicants admittedBarnard College8.8%Cornell: 8.8% of 62,993 applicants admittedCornell8.8%Amherst College: 9.0% of 13,743 applicants admittedAmherst College9.0%UCLA: 9.0% of 146,272 applicants admittedUCLA9.0%NYU: 9.2% of 110,807 applicants admittedNYU9.2%United States Naval Academy: 9.3% of 15,149 applicants admittedUnited States N…9.3%Claremont McKenna College: 9.6% of 6,529 applicants admittedClaremont McKen…9.6%USC: 9.8% of 82,027 applicants admittedUSC9.8%Emory: 10.6% of 33,450 applicants admittedEmory10.6%Middlebury College: 10.7% of 12,540 applicants admittedMiddlebury Coll…10.7%UC Berkeley: 11.0% of 124,242 applicants admittedUC Berkeley11.0%Boston University: 11.1% of 78,769 applicants admittedBoston Universi…11.1%Notre Dame: 11.3% of 29,942 applicants admittedNotre Dame11.3%Tufts: 11.5% of 34,432 applicants admittedTufts11.5%Carnegie Mellon: 11.7% of 33,941 applicants admittedCarnegie Mellon11.7%College of the Ozarks: 12.0% of 2,919 applicants admittedCollege of the …12.0%WashU: 12.1% of 32,754 applicants admittedWashU12.1%Haverford College: 12.4% of 7,341 applicants admittedHaverford Colle…12.4%United States Military Academy at West Point: 12.5% of 12,320 applicants admittedUnited States M…12.5%Harvey Mudd College: 12.7% of 5,094 applicants admittedHarvey Mudd Col…12.7%Georgetown: 12.9% of 26,131 applicants admittedGeorgetown12.9%Bates College: 13.3% of 10,027 applicants admittedBates College13.3%Davidson College: 13.4% of 8,114 applicants admittedDavidson College13.4%Hamilton College: 13.6% of 8,531 applicants admittedHamilton College13.6%Colgate University: 13.9% of 20,682 applicants admittedColgate Univers…13.9%Tulane: 14.0% of 32,609 applicants admittedTulane14.0%Washington and Lee University: 14.0% of 8,213 applicants admittedWashington and …14.0%Wellesley College: 14.0% of 8,714 applicants admittedWellesley Colle…14.0%

The 50 lowest admit rates

Click a column to sort.

Admits divided by applicants, students entering fall 2024 (federal data, the latest year every college reports).The college's own Common Data Set admit rate, where it has published one; usually a year newer (mostly 2025–26). Dash: not published or not yet checked.
1Caltech CA2.6%13,8563563.8% 2025-26Private
2Harvard MA3.6%54,0081,9704.2% 2025-26Private
3Stanford CA3.6%57,3262,067—Private
4Yale CT3.9%57,5172,2274.7% 2025-26Private
5Columbia NY4.0%60,1152,4004.9% 2025-26Private
6MIT MA4.5%28,2321,2844.6% 2025-26Private
7UChicago IL4.5%43,6121,9554.5% 2025-26Private
8Princeton NJ4.6%40,4681,8684.4% 2025-26Private
9Northeastern MA5.2%98,4255,1335.6% 2025-26Private
10Brown RI5.4%48,9042,6385.4% 2024-25Private
11Dartmouth NH5.4%31,6561,7106.0% 2025-26Private
12Penn PA5.4%65,2263,5234.9% 2025-26Private
13Duke NC5.7%51,7952,9575.2% 2025-26Private
14Vanderbilt TN5.9%45,4092,6625.4% 2025-26Private
15Johns Hopkins MD6.4%45,8952,9546.1% 2025-26Private
16Bowdoin College ME7.1%13,2659466.8% 2025-26Private
17Colby College ME7.1%19,1871,360—Private
18Pomona College CA7.1%12,249868—Private
19Swarthmore College PA7.5%13,0659757.5% 2025-26Private
20Northwestern IL7.7%49,4743,8067.5% 2025-26Private
21Rice TX8.0%32,4732,5978.0% 2025-26Private
22Williams College MA8.3%15,4111,2728.6% 2025-26Private
23Barnard College NY8.8%11,8361,04610.1% 2025-26Private
24Cornell NY8.8%62,9935,5168.4% 2025-26Private
25Amherst College MA9.0%13,7431,2387.7% 2025-26Private
26UCLA CA9.0%146,27213,1149.4% 2025-26Public
27NYU NY9.2%110,80710,2329.1% 2025-26Private
28United States Naval Academy MD9.3%15,1491,405—Public
29Claremont McKenna College CA9.6%6,5296269.4% 2025-26Private
30USC CA9.8%82,0278,05011.2% 2025-26Private
31Emory GA10.6%33,4503,56210.3% 2025-26Private
32Middlebury College VT10.7%12,5401,34812.8% 2025-26Private
33UC Berkeley CA11.0%124,24213,63911.4% 2025-26Public
34Boston University MA11.1%78,7698,74912.8% 2025-26Private
35Notre Dame IN11.3%29,9423,3749.4% 2025-26Private
36Tufts MA11.5%34,4323,95710.8% 2025-26Private
37Carnegie Mellon PA11.7%33,9413,95911.1% 2025-26Private
38College of the Ozarks MO12.0%2,919350—Private
39WashU MO12.1%32,7543,95111.9% 2026-27Private
40Haverford College PA12.4%7,34190813.3% 2025-26Private
41United States Military Academy at West Point NY12.5%12,3201,53412.5% 2024-25Public
42Harvey Mudd College CA12.7%5,09464512.3% 2025-26Private
43Georgetown DC12.9%26,1313,37413.5% 2025-26Private
44Bates College ME13.3%10,0271,33614.8% 2025-26Private
45Davidson College NC13.4%8,1141,08512.6% 2025-26Private
46Hamilton College NY13.6%8,5311,16213.6% 2025-26Private
47Colgate University NY13.9%20,6822,87117.5% 2025-26Private
48Tulane LA14.0%32,6094,55914.5% 2025-26Private
49Washington and Lee University VA14.0%8,2131,147—Private
50Wellesley College MA14.0%8,7141,22414.8% 2025-26Private

Admit rates move a point or two a year, so ties are common near the top; the newer-rate column shows where a college's own latest count differs. Your own odds depend on your grades, scores and round: check them school by school.

More data: Early decision vs regular · Where early decision helps most · All data